Training Soft Skills With a Digital Learning Platform
Learn how digital learning platforms can effectively train soft skills such as communication,...

Analytics on learning can be utilized in both measuring skills and developing training. At the same time, the content of the training is documented, as you can always revert to the course log, which has detailed information on the course content.
Online learning platforms give you real-time and objective insight into the learners’ progress. Online training treats all the participants equally, and assessment criteria are the same for everyone. With online training, it is also possible to analyze potential problems with ease.
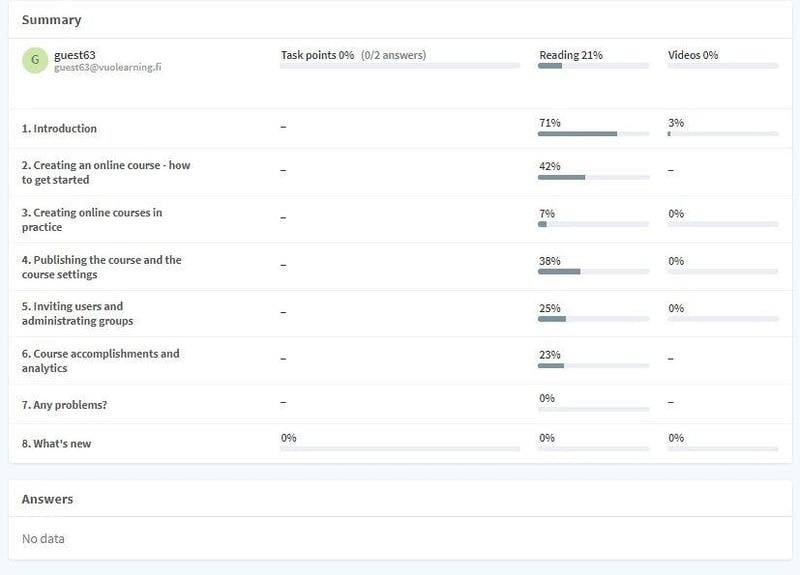
By tracking the amount of the task points, the material read and the videos watched in different parts of the course gives us data on both actions and understanding.
Measuring the level of competence is one of the most often used ways of utilizing learning analytics. Usually, in a course, there is a specific target level of competence that is striven for, and meeting the set target level is measured using assignments and tests.
You can, e.g., require that the learners achieve a specific score to be able to complete the course. Should the expected score not be met, the learner is instructed to retake the training.
In addition to scores, you can also measure reading the content or watching videos. This way, you can make sure that the material is studied even if there were no assignments on a course. The online learning platform measures these factors using, e.g., data on browser movements, i.e., how the learner navigates on the platform.
When you measure both studying the content and understanding it, you also get information on the difficulty level of the training. If the learners have conscientiously gone through the material but cannot answer the assignments correctly, there are often shortages in the basics among the participants, or the course is difficult for some other reason. If, on the other hand, the answers given are correct and no material has been studied, it tells you that the course most probably is too easy for the participants.
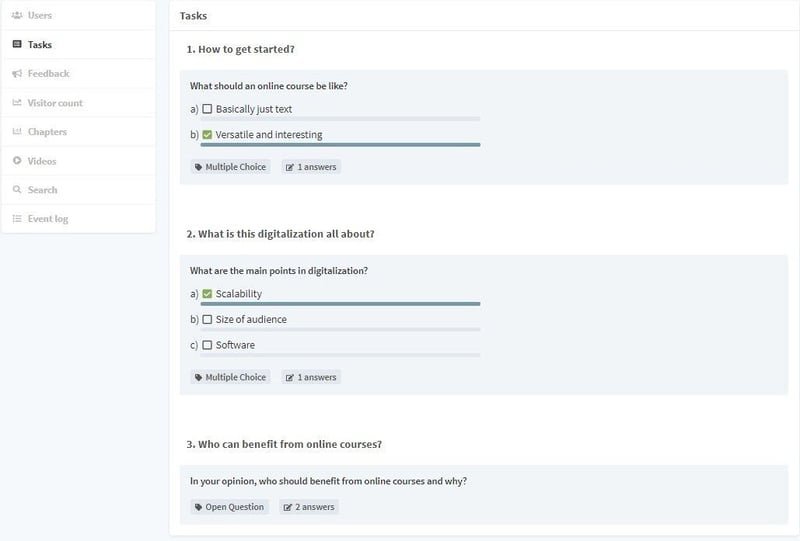
The answer distributions quickly show what proportion of the answers were correct and what kind of wrong answers the learners gave.
In addition to course completions, online learning platforms also keep a record of separate answers to assignments. By examining the answer distributions, it is possible to distinguish the most common errors made by the learners, and thus evaluate which are the subjects that may require additional training.
On some occasions, you may want to revert to occurring problems in courses even after the course has been completed. E.g., you might want to discuss the wrong answers given in safety or data security-related training.
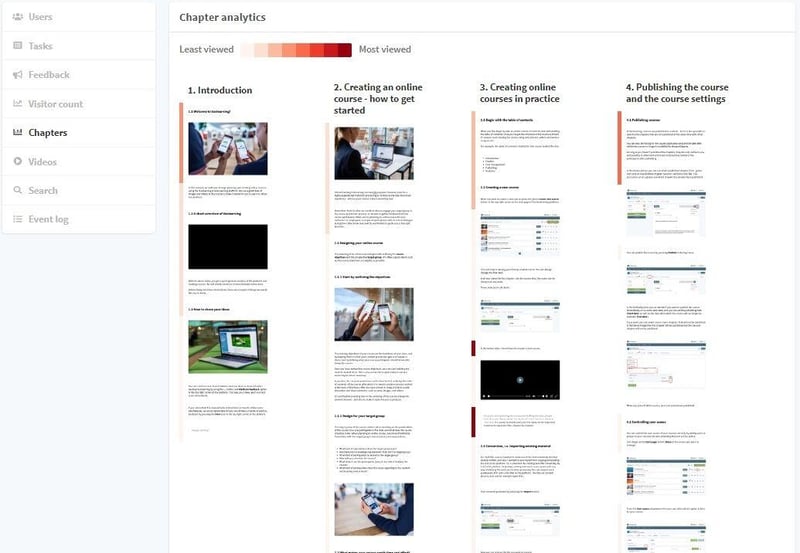
Heatmap visualizes which parts of the content the learners have spent the most time. It gives us data on what is exciting or requires longer to absorb.
Apart from how well the participants have learned the subject matter of the training, analytics also informs you of the fascination of the material. Heatmap uses colors to visualize the parts in which the learners proportionally spend the most time. Usually, it gives away the parts of the contents that are the most interesting from the participants’ point of view.
Video analytics shows you, in addition to view times, also the point of time the participants quit watching the video – useful in finding out if the videos are too long or are of no interest to the learners.
The text searches performed within the course reveal what the subjects that the participants seek information about are. It can be especially useful in the courses that concentrate on different products and services (like software training) in which the administrators can find out what are the functions users seek instructions to, and what are the search words.
You can measure the activity of the participants by tracking the number of daily users.

By observing user peaks, one can see when the participants become active – a great way of, e.g., seeing how actions of internal communications are echoed on the learners’ activity.
In an online course, data accumulates automatically and in real-time. It is an easy way to stay on top of how the participants are progressing in the courses and, on the other hand, how the courses could be developed.
Learn how digital learning platforms can effectively train soft skills such as communication,...
Students can participate in online learning from anywhere, anytime. Online courses enable students...
Mobile learning brings educational opportunities within reach and enables more efficient use of...